“Demographics is destiny,” is a phrase that is way overused and abused. Demographics isn’t necessarily destiny, but it does play a major role in the rise and fall of civilizations. For example Rome the city at its height of power had over a million residents and controlled 100 million subjects. When Rome fell to the Germanic raiders it had only 50,000 residents left and its control did not extend much outside the city. Demographics is important, which in turn may influence where you choose to invest. So we thought it would be interesting to see how the populations represented by some of the international ETFs we follow stack up against the U.S. in terms of demographics.
Using estimates from the U.S. Census Bureau, we calculated the expected population growth over the next 25 years—roughly a generation—as well as the percentage of the population 65 years of age or older, both now and in 2032. For single country ETFs this was easy; for the regional funds we used a weighted average of the constituent countries.
What we found was in some cases surprising. The biggest surprise was that the market with the fastest overall population growth between now and 2032 is not in the emerging markets but rather it is the United States, which is expected to grow 23% from 301 million now to 357 million in the next quarter century.
The population represented by the MSCI Emerging Market index (EEM) is expected to grow 18% over the same period, dragged down by double-digit population declines South Africa (about 8% of EEM assets) and Russia (8%), as well as virtual stagnation in Korea, which is about 14% of the index. This is partially offset by a population explosion in India, but Indian companies are only about 6% of index assets. Meanwhile the one-child policy for urban couples in China (FXI)—adopted in an era of scarcity when few were thinking about having the manpower necessary to sustain growth—has resulted in a relatively slow-growing population, along with a host of other unintended consequences (too many baby boys).
Japan is facing substantial population declines over the coming quarter century and the country also drags down the overall population growth of countries in the MSCI EAFE index (EFA) of developed-markets, since Japanese companies account for nearly 21%. The U.K. (EWU) is preferential to continental Europe, where population declines in Germany, Spain, Italy and Finland are expected to decrease the overall population growth rates for the S&P Europe 350 (IEV), even though U.K. companies represent almost a third of that index.
click to enlarge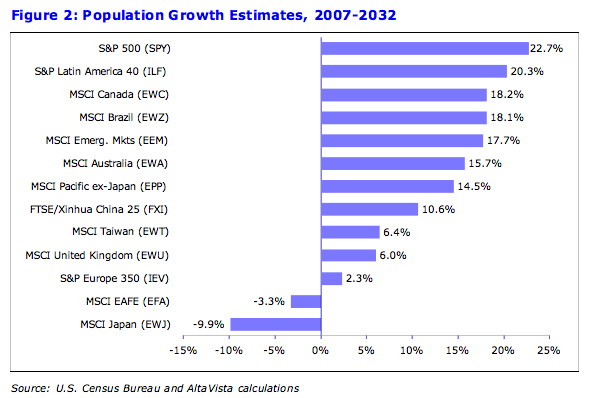
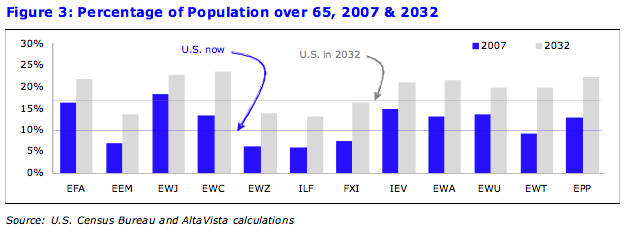
Figure 3 illustrates that a graying population is something which all markets have in common. Japan has the largest percentage of people over 65, with European economies (EFA and IEV) not far behind. And Japan’s “elderly burden” will get worse, although Canada (EWC) is likely to eclipse Japan as the country with the biggest imbalance by 2032.
The U.S. (SPY) has the youngest average population of any developed market, and is expected to keep that designation in the future, but Latin America (ILF) and Brazil (EWZ) take the overall prize for the youngest populations, both now and in 2032.
China may be the first country in history to grow old before it gets rich: by 2032 its elderly burden will be nearly as high as it is in the U.S., but the country won’t have nearly the same resources on a per capita basis to deal with the challenges (then again, its government has not made the same promises).
What does all this mean? Unfortunately it isn’t likely to generate any short-term trading ideas, but it does provide some perspective for a thematic approach to international investing:
- The U.S. is relatively well-off compared with other developed markets. It will be better able to grow its way out of its problems, and its companies could see faster earnings growth, which in turn would justify the slight premium U.S. companies get over European firms (Japanese companies are still more expensive).
- China-hype may be misplaced. China is older than the other emerging markets overall, and is likely to see much slower population growth as well. Twenty-five years from now India will have the world’s largest population, about 100 million ahead of China—and they’ll be much younger too.
- The question of whether Japan is emerging from a roughly 15-year economic slump is academic; in the long run—there is no diplomatic way to say this—the country is dying. Global winners like Toyota (TM) are relatively immune and may thrive regardless, but the fortunes of most of companies in EWJ are undeniably linked to the vanishing Japanese consumer.
- Canada is getting older quickly but it may not matter. Exploitation of the oil sands could turn the country into a nation of wealthy pensioners. Similarly, Australia is getting much older, but will exhibit decent overall population growth and is rich in natural resources that could have a bigger impact than demographics.
To be sure, there are shortcomings in this analysis. First, estimates could be wrong. Societies can undergo significant changes in a quarter century that could alter birth rates, death rates, and immigration, and as a result, demographics. And as alluded to in reference to Toyota, in our global economy it probably makes less difference where a company is headquartered today than it did a generation ago.
But perhaps the biggest shortcoming is the extremely long-term nature of the analysis itself. Because while we pride ourselves on being long-term investors, demographics isn’t destiny, and as the famous economist John Maynard Keynes said, “In the long run, we’re all dead.”