I've covered the VIX and the best way to own a pseudo "VIX ETF" in the past, and given the high-volatility regime we've seen over the past few months, I figured it would be a good time to update this data.
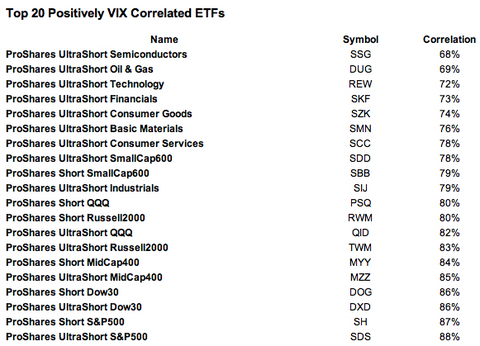
I've calculated the daily log-return correlation of the closing prices of the VIX and 1100 ETFs and CEFs, and the top 20 are shown below. The results are dramatic, as literally every fund is a ProShares fund, and 14 of 20 are UltraShort funds.
As the ProShares Ultra ETFs are based on futures, they tend to need an above-average allocation of risk-free assets (e.g. bonds or money market holdings) to achieve the prescribed double-leverage. I think the results here indicate that either the underlying futures markets are being used as a volatility hedge, or that ProShares themselves are putting some of that unused risk-free capital to invest in long-volatility contracts.
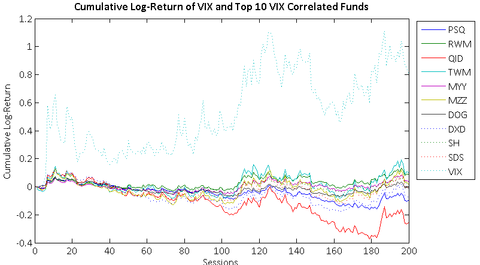
I've additionally included a few other interesting pieces. Below is the cumulative log-return of the VIX and the top 10 of the above 20 funds. Note that although they are all very directionally correlated, the nonlinear magnitude changes of the VIX results in dramatic differences in accumulated returns. This demonstrates that although these funds may provide effective short-term proxies, there is no substitute for a long-term long-volatility contract in the current ETF market.
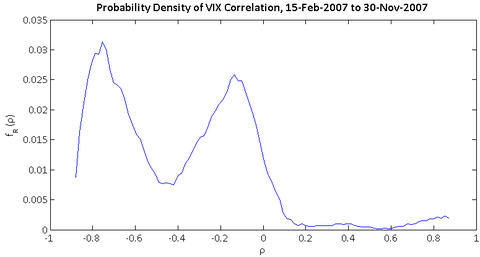
For those interested in the distribution of VIX correlation across the entire ETF market, here is the probability density of correlation against the VIX for 1,100 ETFs and CEFs. Note its bimodal nature, with a large number of strongly negatively correlated funds and a large number of mildly negatively correlated funds. Only 8% of all funds are non-negatively correlated with the VIX.


No comments:
Post a Comment